|
DS Online Tutorials: Data Visualization with Tableau The Digital Scholarship Team has collaborated with Dr. Jacqueline Wong from Department of Decision Sciences and Management to produce a series of online tutorials on Data Visualization with Tableau to facilitate teaching and learning. Clips were worked by Miss Chu Choi Yiu Simchah (IBBA 2020) of the project team. The project is funded by Courseware Development Grant Scheme (2019-22) of CUHK. The online tutorial has 9 short videos (Playlist):
|
Data Visualisation 101 - Design Principles - Javier Cueto, Joel Opulencia & Akiko Harayama - UN Innovation Network
Date: 2021.07.02
In this online lecture, it will discuss different ways to represent data, how to choose the right one. explore design principles and discuss 7 steps for an effective infographic.
Uber Engineering: Data Visualization at Uber - Uber Engineering
Date: 2016.12.09
The video is the presentation made by software engineer Shan He. The presentation demonstrates the interesting case of Uber in using data visualisation in business world.
The Beauty of Data Visualization - David McCandless - TED-ed
Date: 2012.11.23
This video documents a public lecture given by David Candless, a prominent data-journalist on good design of data visualisation and how it can change the way we observe the world.
General
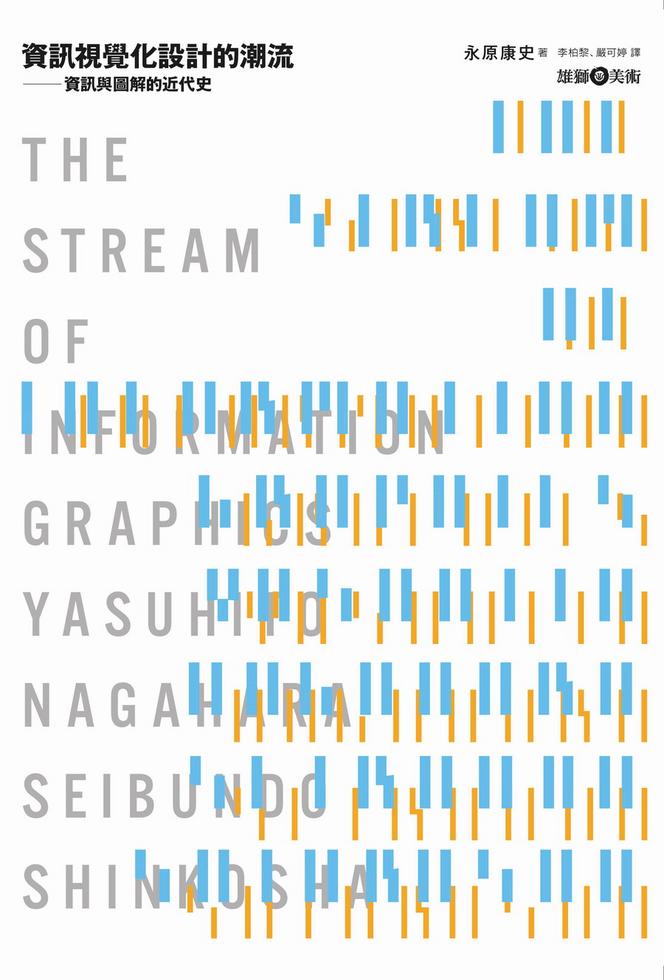
 資訊視覺化設計的潮流 : 資訊與圖解的近代史 by
 Tools