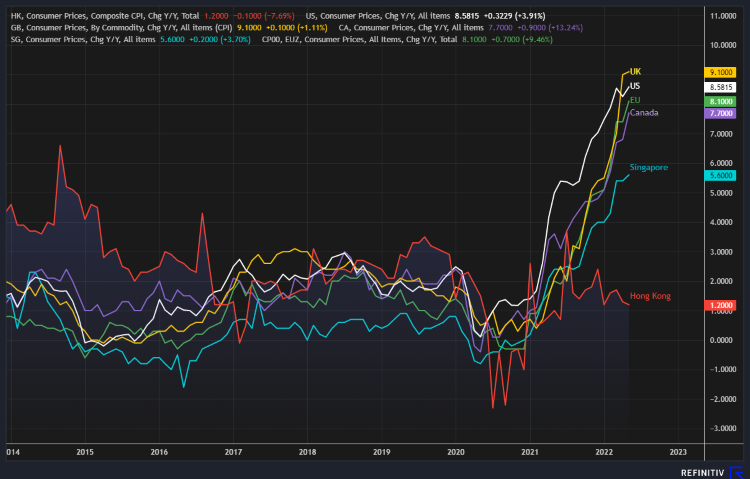
Most countries around the world have been undergoing an increasing upward pressure on the price levels as shown by consumer price index, including the United States, the United Kingdom, the EU zone, Singapore and so on. Nonetheless, Hong Kong stands out in the crowd with its price level hovering around 1 to 2%. In May The consumer price index of Hong Kong declined to 1.2% whereas the US reached 8.58% to mark a 40-year high. To understand why Hong Kong’s CPI stays at a low level, we need to first examine the breakdown of the CPI’s components.
Figure 1: Consumer Price Index change(%) Y/Y of selected economies
The breakdown of Consumer Price Index in Hong Kong
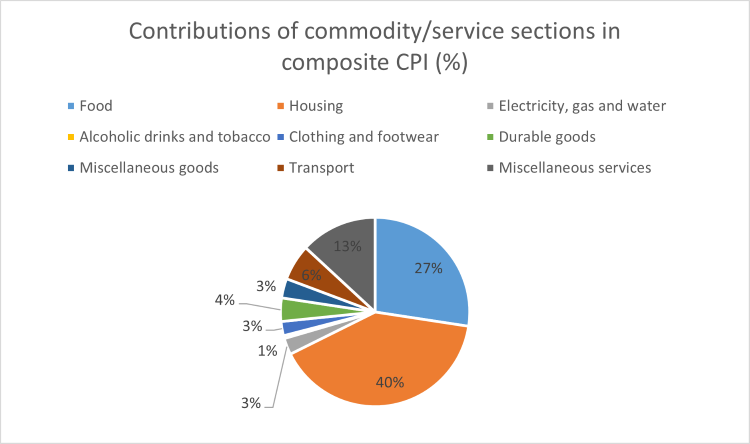
Figure 2: Contributions of commodity/services sections in composite CPI
Source: C&SD
According to “the annual report on the consumer price index” compiled by C&SD, Housing has the highest weighting of 40%, meaning that a 10% change in housing translates to a 4% change in the CPI index. Food, Miscellaneous services (including Educational, information and communications and medical services, etc) and Transport rank the second, third and fourth on weighting, accounting for 27%, 13% and 6% respectively. The weight of the 4 major contributions above total 86%, which can largely explain the behaviour of the CPI index.
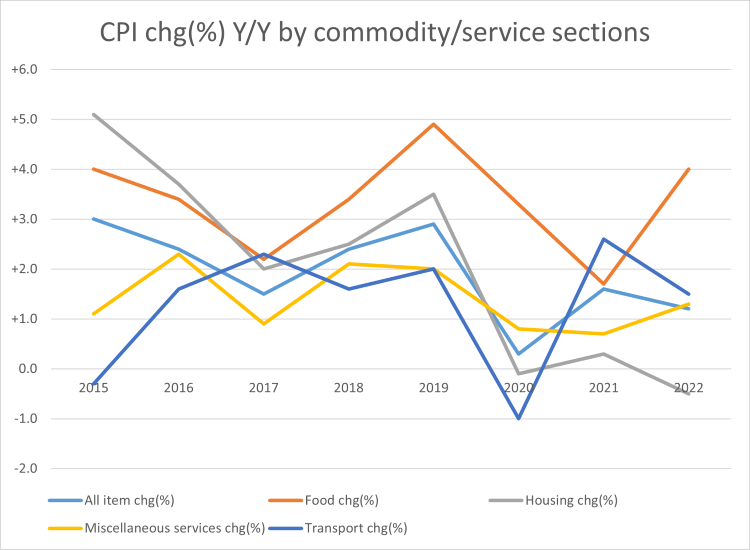
Figure 3: CPI change(%) Y/Y by major commodity/service sections
Source: C&SD
*Data of 2022 refer to the number in May 2022
According to the times series data of composite consumer price indices, the percentage change in all items, representing the percentage change of the composite consumer price index, dropped from 2.9% to 0.3% from 2019 to 2020 and then rebounded to 1.2% in 2022. The trend of the composite CPI aligned the most with the housing index throughout the period, which totally makes sense considering housing shares the biggest weight among all sections. Be noted that private housing rent and public housing rent account for 35.46% and 1.87% out of the 40% weight attributed to the housing index.
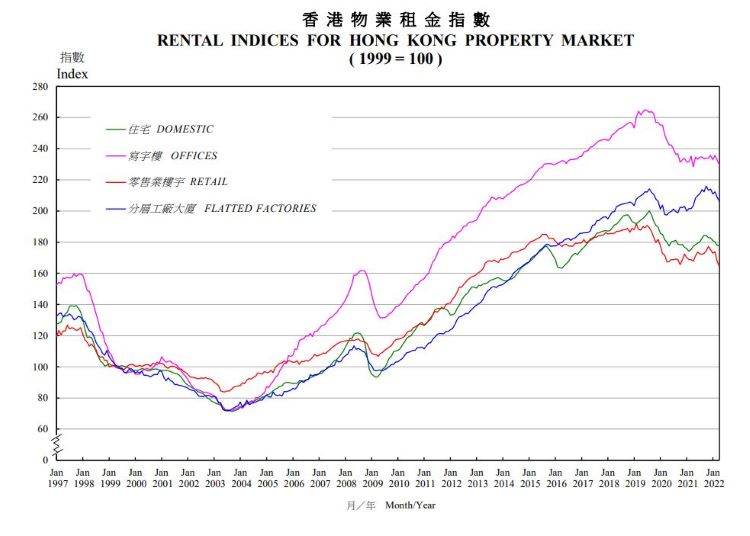
Figure 4: Rental price trends by property types in Hong Kong 1997-2022
 Source: Rating and Valuation Department
Figure 4 shows the trends of rental prices by property type in Hong Kong. The whole market experienced a huge downward pressure from 2019 to 2020 with most of the rental indices dropping by around 10% in the period, including the domestic rent captured in the CPI basket. The falling momentum was rather short-lived and vanished in 2021 where the indices have remained steady since then. In Jan 2022, the domestic rental index dropped to below 180, back to the level of 2017. To simply put, the decline in rental prices is highly responsible for dragging down the consumer price index in recent years.
How the weight was set for each section?
According to “Introduction to the Consumer Price Index” by compiled by C&SD, CPI measures the price level changes by comparing the total cost needed to buy a basket of consumer goods and services over time. The set of expenditure weights is derived from the results of the Household Expenditure Survey(HES) and supplementary information, which will be updated every 5 years to ensure the up-to-date expenditure patterns of households.
Due to the Covid-19 pandemic, the expenditure pattern changed rapidly which will likely reduce the reliability of the CPI in reflecting the true consumption behaviour. Hence, C&SD is poise to conduct special reviews annually to update the expenditure weights before the next round of full-scale rebasing exercise in 2024/25.
Figure 5: CPI change(%) Y/Y by major commodity/service sections
Source: C&SD
*Data of 2022 refer to the number in May 2022
By observing the changes in CPI indices of different sections, we could spot the diverging trends between transport & housing and food & miscellaneous services from 2021 onward. The former group is falling and the latter climbing up. When a household’s expenditure on a section increases, so might the expenditure weight in total spending, and vice versa. Hence, the quicker the expenditure patterns change, the more frequent the reweighting is needed in general.
References:
- https://www.censtatd.gov.hk/en/data/stat_report/product/B1060002/att/B10600022021AN21B0100.pdf
- https://www.censtatd.gov.hk/en/data/stat_report/product/B8XX0021/att/B8XX0021.pdf
- https://www.censtatd.gov.hk/en/scode270.html
- https://www.rvd.gov.hk/en/publications/property_market_statistics.html


