
Executive summary:
- The number of RHQs in Hong Kong grew steadily in the long run, despite dropping for two consecutive years in 2020 and 2021.
- The number of RHQs from mainland China rose exceptionally in recent years, narrowing the share gap with the US, the head in the list.
- Over half of RHQs engaged in import/export trade, wholesale and retail, followed by financing and banking (16.4%), professional, business and education services (15.9%) and then transportation, storage, and courier services (8.2%).
- 86% of RHQs’ employees were hired by a small proportion of mega-sized companies.
- The proportion of local offices doubled in the past two decades, while RHQs and ROs decreased collectively.
Definitions of some terms
Regional headquarters(RHQs): An office with a parent company located outside Hong Kong which has managerial control over offices and/or operations in the region.
Regional office (RO) : An office with a parent company located outside Hong Kong which coordinates offices and/or operations in the region
Local office: An office with a parent company located outside Hong Kong which only takes charge of the business in Hong Kong and nowhere else.
I. The number of RHQs in Hong Kong grew steadily in the long run
 Sources: the census and statistics department, HKSAR
Figure 1.1 depicts the number of RHQs es in Hong Kong. The number showed a long-lasting upward trajectory from 1991 to 2021, with the latest number in 2021 standing at 1,457 which has risen 1.42 times compared to 1991. Nonetheless, the number dropped for two years in a row up during 2020 and 2021.
Figure 2.1 illustrates the year over year growth rate regarding the number of RHQs in Hong Kong. Despite the positive growth in the long run, the YOY growth rate displayed a volatile momentum throughout the recorded period, being comparatively erratic from 1991 to 2009 compared to 2009-2021.
Most of the time, the rate was fluctuating in the positive range, except for those years coupled with overwhelming crises, including 1998(Asia financial crisis), 2008(Financial tsunami), 2016(Crash in China’s stock market)and 2020-2021(Social unrest and the pandemic). The sharpest dive of 9.3% occurred in 1998 when the Asia Financial Crisis struck the economies and stock markets over most of the Asian countries.
It should be noted that, under the backdrop of the prolonged social unrest and outbreak of COVID-19 in Hong Kong, for the first time since the record began, the growth rate stayed in the negative zone for two consecutive years.
 Sources: the census and statistics department, HKSAR
Figure 2.1 illustrates the number of RHQs established by the four major countries in Hong Kong from 1991 to 2020. Overall, there was a rising trend in the number of RHQs established by all 4 counties during the period, with the US remaining at the highest for the whole time, whose RHQs establishments topped at 333 in 2012.
However, the number of RHQs from the US and Japan started to show a falling momentum since 2012 and 2013, whereas the number from mainland China performed the other way around which demonstrated a longstanding and sharp increase since 2011, doubling the number of RHQs to 238 in 2020. The number of RHQs from mainland China surpassed that from the UK in 2015 and then Japan in 2020 respectively, to rank the second-highest in 2020.
If we look at figure 2.2 (share in the total number of RHQs by country) over time, it is shown that while the share of the UK kept decreasing steadily throughout the entire period, the US and Japan echoed with the same trend since 2012 and 2007 respectively. However, when one was falling, the other was rising. The share of mainland China shot up from 8.7% in 2011 to 15.8% in 2020, only 2.9% lower than the US and just one step away from seizing the championship.
II. Narrowing divergence in the share of RHQs between mainland China and the US
 Sources: the census and statistics department, HKSAR
Figure 3.1 and 3.2 shows the share in the total number of RHQs by country respectively in 1993 and 2020. Despite the position of the top 4 largest share countries remaining the same, only mainland China’s share had increased during the past three decades or so, while the share of the other three counterparts, the US, UK and Japan, dropped together.
The US lost the largest piece of share in the period, dropping from 33% to 21% and The UK followed with a 4% decline, albeit Japan’s share stayed roughly the same. In contrast, mainland China’s share jumped from 12% to 17%, obviously narrowing down the gap to the US. In addition, the share of Germany and France both climbed up slightly by 2-3% during the period.
It is clear that with the long-lasting rapid growth of China’s economy and the expediting economic integration between Hong Kong and Mainland China, the presence of mainland China’s companies in Hong Kong has been expanding in recent decades and crowing out the market share of the companies from other countries at the same time.
III. Over half of RHQs engaged in trade, wholesale and retail

Figure 4.1 demonstrates the number of RHQs by the major line of business in 2020. In the total of 1504 RHQs in 2020, more than 50% of such were engaged in import/export trade, wholesale and retail. This was followed by financing and banking (16.4%), professional, business and education services (15.9%) and then transportation, storage, and courier services (8.2%). Generally speaking, the major line of business of an RHQ was usually in the same category as that of its parent company, except for the manufacturing.
The number of RHQs with parent companies engaging in the manufacturing sector was much higher than that engaging in manufacturing in Hong Kong. According to the explanation of the Census and Statistics Department, it was because quite a number of RHQs engaged in import/export trade, wholesale and retail in Hong Kong serves as a base to provide sales and related services for products manufactured by their parent companies outside Hong Kong.
Figure 4.2 illustrates the number of RHQs by geographical responsibility in the region in 2020. The majority of RHQs (1135 out of 1504) was responsible for the businesses/operations in mainland China, followed by Singapore, Taiwan, Japan and Korea with around 300-500 RHQs serving each of the countries/regions.
IV. 86% of RHQs’ employees were hired by a small proportion of mega-sized companies
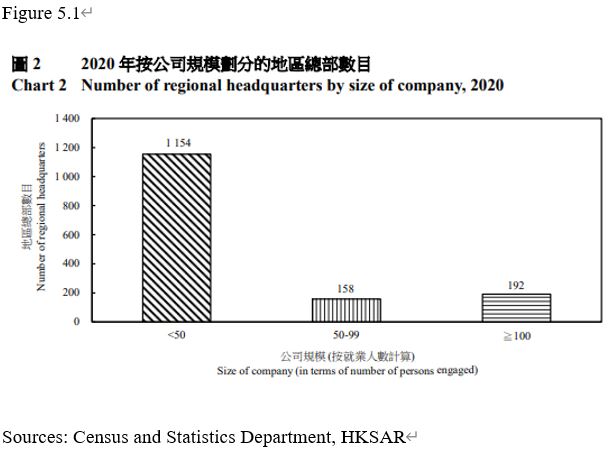
Figure 5.1 depicts the size of RHQs established in Hong Kong in 2020. Out of 1504 RHQs in total, 1154 RHQs were hiring less than 50 employees, accounting for 76.7% of the total number of RHQs. Comparatively, the number of RHQs with employees “between 50 to 99” and “not less than 100” were much lower, referring to only 10.5% and 12.7% of the total RHQs.
However, in the total of about 177,000 employees hired by the RHQs, 86% were employed by the companies with “not less than 100 employees”. It implies that although the small and medium-sized RHQs outnumbered the larger RHQs, the latter one remarkably outsized the small and medium-sized RHQs in terms of recruitment scales.
V. The number of offices with regional functions levelled off in the recent decade
 Sources: Census and Statistics Department, HKSAR
The figure depicts the growing trend of different kinds of regional offices in recent decades. The number of total offices constituted by RHQs, ROs and local offices presented a clear rising trajectory throughout 2001-2021.
When looking into the details, it is shown that the number of RHQs increased slowly throughout the entire period, while the number of ROs underwent a decline and then levelled off after peaking at 2644 in 2007. On the other hand, the number of local offices kept soaring since the record began, reaching 5,109 in 2021 which tripled the number compared to 2001.
VI. The proportion of local offices doubled in the past two decades
 Sources: Census and Statistics Department, HKSAR
The constitution of different offices changed remarkably in proportion between 2001 and 2021, where the local offices doubled the share in the past two decades to outrank RHQs and ROs whose shares dropped collectively. In the recorded period, the share of ROs plunged drastically from 51% to 27%, while the share of RHQs slightly fell by 5%.
Although the number of local offices shot up considerably, it was set up to only take charge of the business in Hong Kong and nowhere else. Meanwhile with the drop of share in offices carrying a regional management responsibility, it may be a warning sign indicating that the strategic role of Hong Kong acting as a district command centre in Asia was fading gradually.
Reference:
https://www.censtatd.gov.hk/en/EIndexbySubject.html?pcode=B1110004&scode=360