CUHK
News Centre
International astronomy team releases largest-ever collection of 3D maps of nearby galaxies
The Sloan Digital Sky Survey (SDSS) research team formed by hundreds of international leading scientists has recently released the complete dataset of spectral maps of 10,000 galaxies, the largest galactic survey of its kind, following six years of effort. The Chinese University of Hong Kong’s (CUHK) Physics team, the only representative from Hong Kong in the SDSS team, is responsible for collecting data on stars of many kinds of spectra to establish a database of galaxies. Through working with stellar spectra data, astronomers can better understand the history of different galaxies, and the birth and evolution of the universe.
There are several hundred billion galaxies in the observable universe beyond the Milky Way, in which Earth’s solar system is located. A galaxy is a huge system made up by stars, such as the sun, interstellar gases and dark matter; it is also where stars are born, evolve and die. Over the past decades, astronomers have conducted surveys to discern the formation and evolution of stars by detecting electromagnetic radiation and forming pictures of them to compare one with another. In 2014, SDSS initiated the Mapping Nearby Galaxies at Apache Point Observatory (MaNGA) project, using novel fibre-bundling technology to map out detailed spectral maps of nearby galaxies.
Professor YAN Renbin, Associate Professor of the Department of Physics, CUHK, is the MaNGA project’s Survey Scientist. He and his research team are responsible for analysing galaxy spectra data. Professor YAN is also the principal investigator of MaStar.
“Analysing galaxy spectra is a bit like hearing a symphony,” said Professor YAN. “We hear the sound from the entire orchestra at once, but we can only understand the music if we recognise all the characteristics and features of each of the instruments playing. What we did at MaStar is to build a special kind of library that includes spectra for as many types of stars as possible. Using these data, we can figure out how many of each type of star add up to make each of the many spectra from a MaNGA galaxy, and reconstruct the most accurate view ever of when and where stars formed in that galaxy’s cosmic history.”
Novel fibre-bundling instrument maps spectral library of 10,000 galaxies

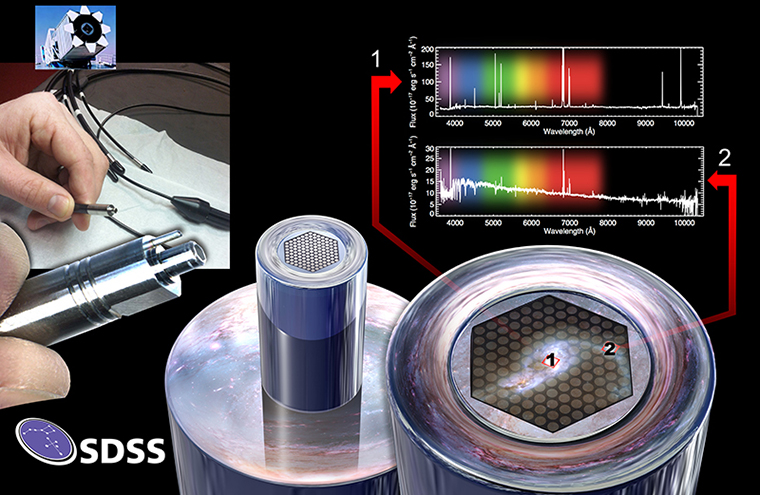
The fibre-bundling instrument used in the MaNGA project.
Image credit: Dana Berry / SkyWorks Digital, Inc., David Law, SDSS Collaboration
Hubble Space Telescope image credit: NASA, ESA, the Hubble Heritage (STScI/AURA)-ESA/Hubble Collaboration, and A. Evans (University of Virginia, Charlottesville/NRAO/Stony Brook University)
The fibre-bundling instrument used in the MaNGA project is formed by the hexagonal arrays of tightly-packed fibre-optic cables, which allows researchers to observe 17 galaxies at a time, and at an efficiency of 20 times greater than similar telescopic instruments used in previous surveys. The research team is able to measure spectra at tens to hundreds of separate points in each galaxy at once. These spectra include data on the amount of light at different wavelengths, including visible and near-infrared light, resulting in a “data cube” that contains the complete spectroscopic profile of a galaxy.

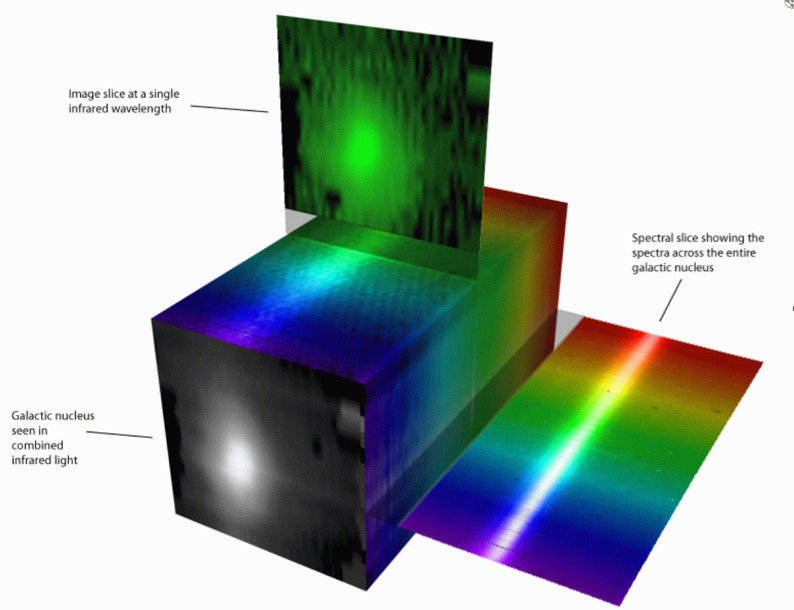
This picture shows the concept of a data cube. The data obtained by MaNGA’s measurement of each separate point in the galaxy is expressed by a 1D spectrum. Combining the 1D spectrum of every point forms a 3D “data cube” that represents the spectral data of the entire galaxy. Image Credit: Stephen Todd (ROE) and Douglas Pierce-Price (JAC)
To retrieve celestial information from the data cube was the primary concern for the MaNGA team, but they could not get over the narrow light wavelength coverage and the lack of star variety in the existing stellar spectral library. Therefore, SDSS carried out the “MaNGA Stellar Library” (MaStar). It now has the spectral information of 24,000 stars in the Milky Way, the largest and most complete dataset of its kind, providing a set of references for comparison to the MaNGA galaxies, or galaxies outside the Milky Way. MaStar enables astronomers to more accurately extract and process information from the MaNGA data cube, reveals detailed information to help find the ages and motions of the stars, and to map ionised interstellar gas to estimate how many newborn stars are forming at each location.
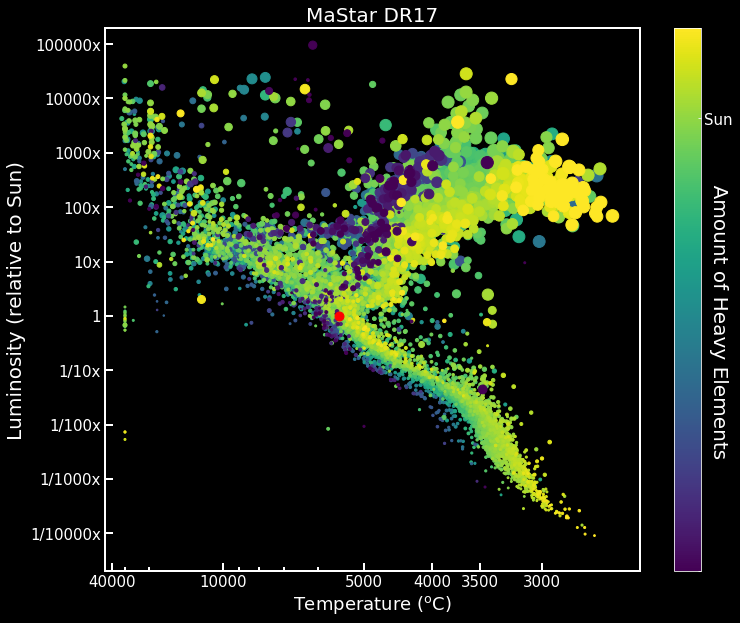
The Hertzsprung-Russelll diagram for the nearly 12,000 stars out of 24,000 stars observed by MaStar. Each little circle in the diagram represents a unique star (the red circle represents the sun), and shows its relative luminance and amount of heavy elements to the sun, as well as the gravity and temperature on its surface. Image credit: Professor YAN and the SDSS collaboration
Professor YAN believes that the success of MaNGA and MaStar, along with the instrumentation innovations developed, will reverberate through the future of astronomical discovery and research. The next generation of SDSS (SDSS-V) is expanding on the novel fibre-bundling methods developed for MaNGA to construct even larger fibre bundles for its Local Volume Mapper (LVM) programme. This survey will also study interstellar gases and newly formed stars located in the Milky Way galaxy and nearby smaller neighbours. Professor YAN will also lead the Affordable Multiple Aperture Spectroscopy Explorer (AMASE) programme to gain a much deeper understanding of how interstellar gases and stars coexist and interact throughout a galaxy’s lifetime.
All MaNGA and MaStar data were upload to:
MaNGA: https://www.sdss.org/surveys/manga/
MaStar: https://www.sdss.org/surveys/mastar/
Professor YAN Renbin’s profile: http://www.phy.cuhk.edu.hk/people/teaching/rbyan.html
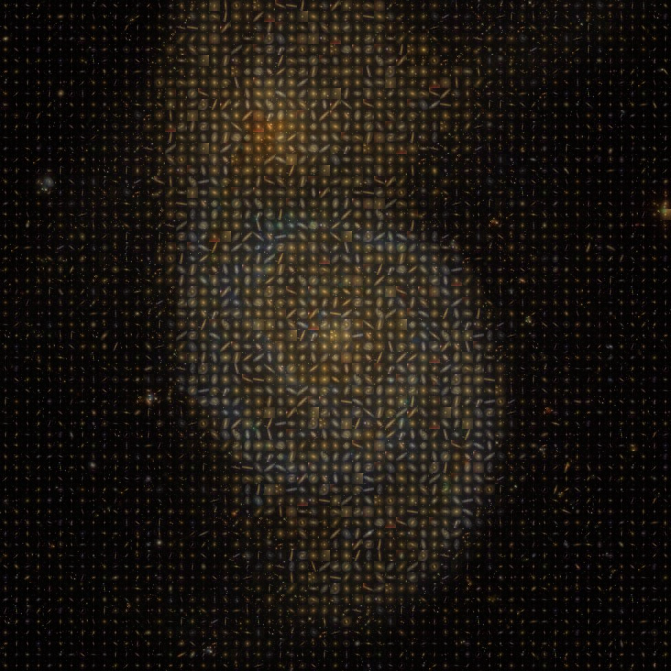


An image of the Whirlpool galaxy (M51); an iconic nearby galaxy, made using a Mosaic of images of one thousand galaxies, ten percent of the entire in the MaNGA sample.
Image credit: Karen Masters and the SDSS collaboration
The fibre-bundling instrument used in the MaNGA project.
Image credit: Dana Berry / SkyWorks Digital, Inc., David Law, SDSS Collaboration
Hubble Space Telescope image credit: NASA, ESA, the Hubble Heritage (STScI/AURA)-ESA/Hubble Collaboration, and A. Evans (University of Virginia, Charlottesville/NRAO/Stony Brook University)
This picture shows the concept of a data cube.
The data obtained by MaNGA’s measurement of each separate point in the galaxy is expressed by a 1D spectrum. Combining the 1D spectrum of every point forms a 3D “data cube” that represents the spectral data of the entire galaxy.
Image Credit: Stephen Todd (ROE) and Douglas Pierce-Price (JAC)
The Hertzsprung-Russelll diagram for the nearly 12,000 stars out of 24,000 stars observed by MaStar. Each little circle in the diagram represents a unique star, and shows its relative luminance and amount of heavy elements to the sun, as well as the gravity and temperature on its surface. Image credit: Professor YAN and the SDSS collaboration

Professor YAN Renbin’s profile: http://www.phy.cuhk.edu.hk/people/teaching/rbyan.html