Improving Navigation Safety: Towards Automation of Maritime Chart Generalisation
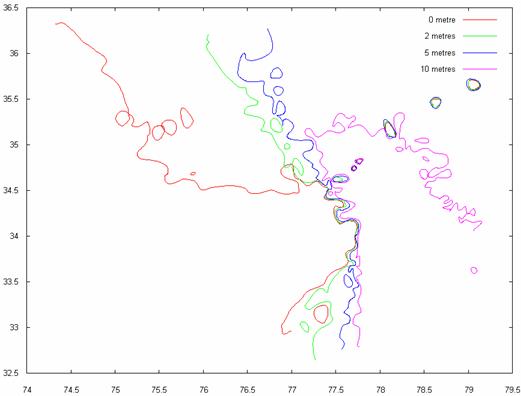
The main purpose of a marine chart is to give a schematic representation of a submarine relief according to the scale of the chart and its purpose. Therefore, the goal of chart generalisation is to produce charts which are as close as possible to reality while ensuring the legibility of the chart and mostly the safety of the user. In our work, we focus on the generalisation of isobathymetric lines (contour lines) for maritime charts (figure 1). Currently, this operation is mostly performed manually however, with the arrival of new sounding techniques and the increasing amount of data, new techniques must be developed as manual processing is no longer conceivable.

Figure 1: Left, isobathymetric lines before (left) and after manual generalisation.
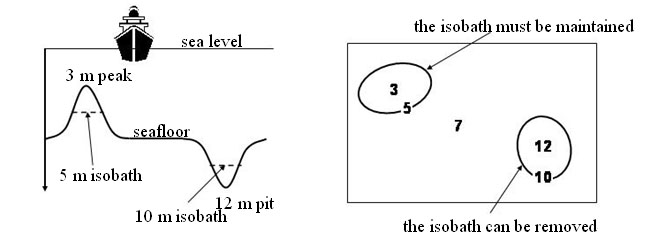
The main constraints that have to be respected during the process are the legibility constraint (a minimal distance must be observed between the lines so that information can be properly read) and the safety constraint. That means that on a chart, the indicated depth must never be deeper than the real depth so that the sailor will not try his way in a too shallow area (Figure 2). As a consequence, an isobath can only be deformed or displaced towards greater depth and an isobath characterising a peak must be maintained.

Figure 2: Illustration of the safety constraint.
The objective of the project is to define a set of algorithms and to combine them in order to perform the different generalisation operations. The research work is conducted in three different parts: (1) definition of a smoothing operator; (2) definition and combination of different generalisation operators; (3) definition and validation of a generalisation strategy.
The smoothing operator is based on a snake model. The principle is to reduce the overall curvature of the isobath in order to remove oscillations and sharp angles. Two points are taken into account. The safety constraint imposes that deformation are performed towards greater depths so that the resulting curve is entirely located on the side of greater depth. Visibility conflicts such as cusps or curve segments which are too close must be corrected by removing some segments in order to ensure the legibility of the result (Figure 3).

Figure 3: Isobath smoothing preserving the safety constraint.
Based on this operator, an aggregation and a displacement operators have been defined. Combined with an enlargement and a deletion operators, they provide a set of operations for cartographic generalisation (Figure 4). The last stage is to define a strategy, i.e. a set of rules to decide which operator to apply. For that purpose, spatial relationships between the isobaths and some quality estimators must be defined. The quality estimator is used both to choose the operators and to validate the process by estimating the deformations done to the surface defined by the isobaths.


Figure 4: Cartographic generalisation of a set of isobaths by applying smoothing, displacement,
aggregation and deletion operators. The colours correspond to the depth of the isobaths.
Units are in centimetres and correspond to the location on the final chart.
Please contact Dr. Eric GUILBERT for further information.


